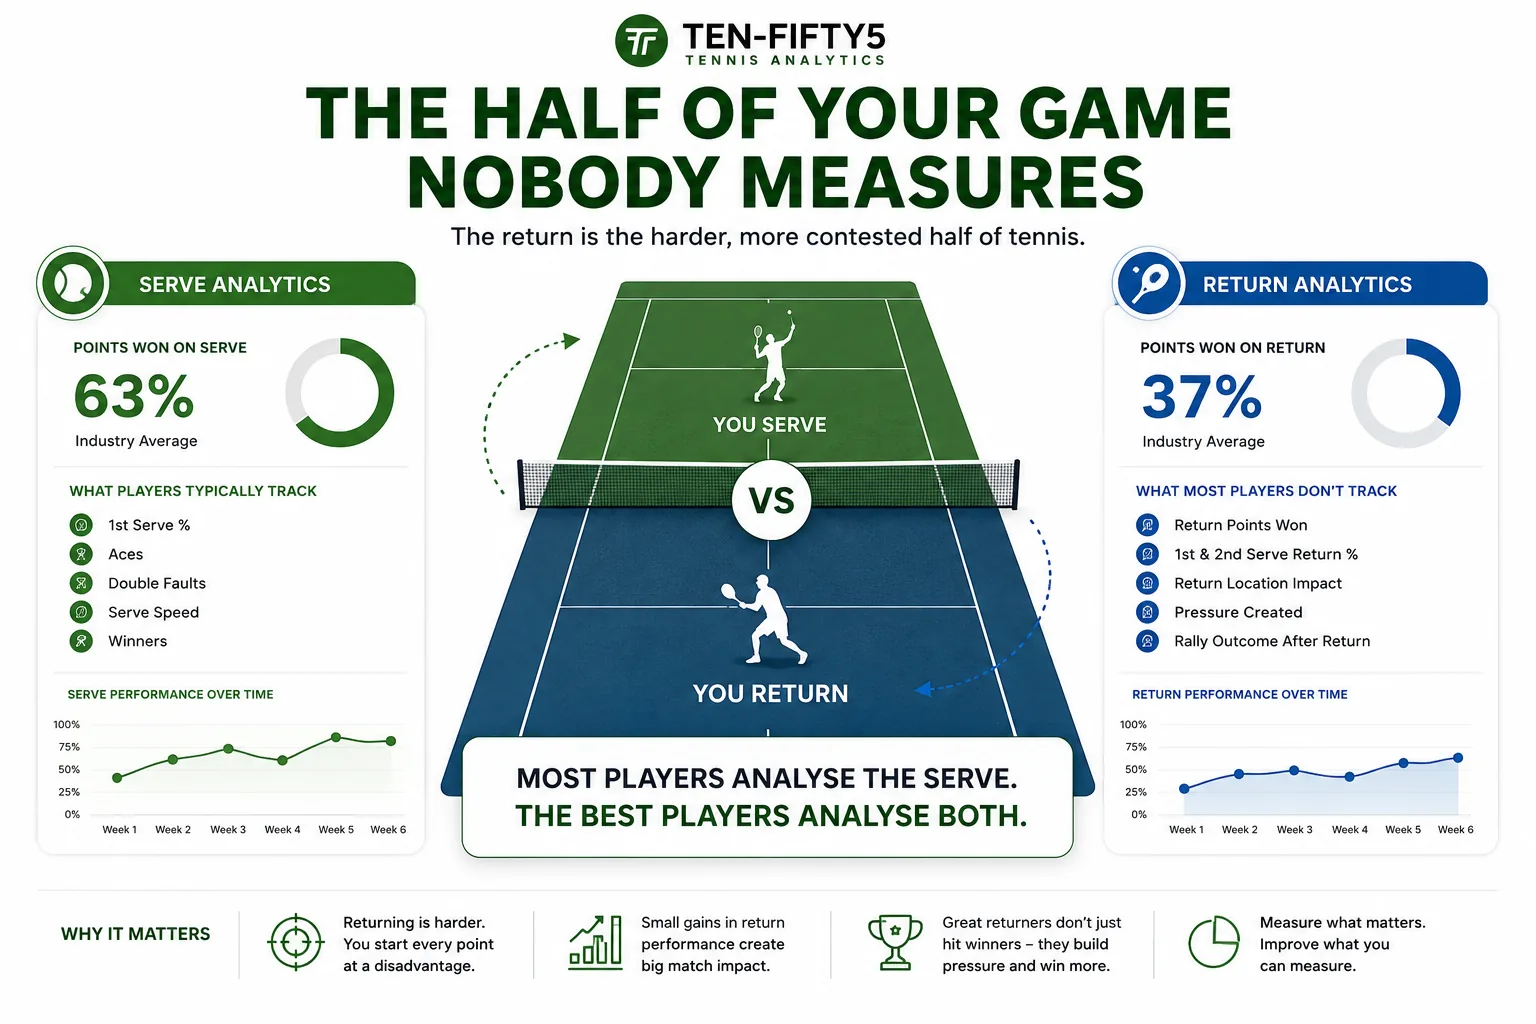
The half of your game nobody charts
Ask most serious club players how their serve is going and they can tell you their first-serve percentage, roughly how many aces they hit, maybe even which way they like to go on a big point. Ask them about their return and you get a shrug. Yet across every level of the game, players win around 63% of the points they serve and only 37% of the points they return — which means the return is the harder, more contested half of tennis, and the half almost nobody measures.
That gap is exactly where matches are won. A break of serve is worth far more than holding your own, because everyone expects you to hold. The player who turns even a handful of extra return points into break points is the player who walks off court with the win. The problem is that returning happens fast, under pressure, and reactively — so it is almost impossible to judge honestly from memory. You remember the two returns you crushed for clean winners and forget the fifteen you floated short into the middle of the court.
Returns are the most under-analysed shot in amateur tennis, and that makes them the single biggest opportunity in your data. This guide breaks down the return statistics that actually decide matches, the patterns to look for in your own numbers, and how automated match analysis turns a chaotic, reactive shot into something you can train with intent.
The five return metrics that matter
Not every number is worth tracking. These five tell you almost everything about the health of your return game.
- Return points won % — the headline figure. What share of your opponent's service points did you win? Anything above 37% means you are returning better than the average player; consistently above 40% and you are a genuine threat on return.
- First-serve vs second-serve return win % — split your return performance by the serve you faced. Most players are far too passive on second-serve returns, treating a 75 mph second serve with the same caution as a 110 mph first. The second-serve return is your best break opportunity in the match, and the data usually shows you are leaving points on the table there.
- Return depth — did your return land deep, in the middle third, or short? Depth neutralises the server. A deep return pushes them back and takes away their easy first-strike forehand; a short return invites them to step in and dictate. Depth is the single most coachable return habit, and it shows up clearly on a court map.
- Return direction and placement — where are your returns going? Cross-court, down the line, or floating through the middle? The middle of the court is where returns go to die: it gives the server the easiest next ball and the widest angles. Knowing your placement spread tells you whether you have a plan or you are just making contact.
- Break points created and converted — the bottom line of return performance. How many break points did your return game generate, and how many did you take? A player who creates plenty but converts few has a pressure problem, not a return problem — and that is a completely different thing to train.
Track these five and you stop guessing about the most important contested shot in your game.
What the patterns reveal
Numbers on their own are just trivia. The value comes from the patterns that emerge once you have them across several matches.
The most common pattern in amateur data is the passive second-serve return. You will often see a player winning a respectable 35% of points against first serves but only 45% against second serves — when good returners push that second-serve number past 55%. That gap is free break points. If your data shows it, the fix is rarely technical; it is a decision to step in, take time away, and treat the second serve as an attacking opportunity rather than a rally starter.
The second recurring pattern is the short-return collapse. Plot your return depth and you may find that under pressure — break points, third sets, against bigger servers — your returns creep shorter and more central. That is your body protecting itself by just getting the ball back. It feels safe and it loses points, because a short return hands the server the initiative. Seeing it on a depth map is what makes it real enough to fix.
Then there is surface and server adaptation. The right return strategy changes with what you are facing. Against a big first serve, depth and neutralising matter most — get the point back to neutral and play from there. Against a weaker server, placement and aggression win. The best returners read serve direction early and commit. Your match-by-match data shows whether you are actually adapting or running the same return on autopilot regardless of the opponent in front of you.
These are not insights you can pull from memory after a tense three-setter. They only appear when every return is logged, located, and counted — which is precisely what computer-vision match analysis does automatically.
Why the return has been so hard to measure
Serving is a closed skill. You stand at the same spot, toss the ball, and repeat a motion you own. It is easy to film, easy to count, easy to coach. Returning is the opposite: it is open, reactive, and decided in under half a second. You do not choose the serve you face, the spin, the speed, or the placement, and you have a fraction of the time to respond.
That is exactly why returns have stayed a blind spot for so long. Manually tagging every return in a match — the serve faced, the depth achieved, the direction chosen, the outcome — is hours of painstaking work that only touring pros with analyst teams could justify. So the amateur game simply stopped measuring it and fell back on feel. And feel, when it comes to a shot this fast and this emotional, is deeply unreliable.
This is the shift that automated analysis brings to the serious recreational and junior game. Upload one match filmed on any camera and the system reconstructs every point: which serve you faced, where your return landed, how the point played out. You do not tag anything. You get a return profile that used to require a professional analyst, applied to your Tuesday-night league match. Recent moves across the category — including new return-of-serve breakdowns in mainstream tennis apps — confirm the whole industry is waking up to how much was being left unmeasured.
Turning return data into break points
Reading your return numbers is the start; the point is to change how you train and play.
- Set a depth target. If your data shows short, central returns under pressure, make depth your single focus for a block of practice. Aim returns past the service line into the back third. One clear target beats five vague ones.
- Attack the second serve. If your second-serve return win rate lags your first, give yourself permission to step inside the baseline and take the ball early. Track the number over the next few matches and watch it move.
- Pick a side and commit. Floating returns through the middle is the most common leak in club tennis. Decide — cross-court depth as your default, down-the-line as your change-up — and let your placement data tell you whether you are executing.
- Review break points specifically. Filter your matches for the break points you created and study what your return did on those points. Patterns under pressure are where the real gains hide.
For juniors and the parents and coaches tracking their development, the return profile is one of the clearest long-term progress markers there is. A defender becoming a counter-puncher, a passive returner learning to attack the second serve — these shifts show up in the trend lines months before they show up in the win-loss record. That is exactly the kind of development a coaching workflow is built to surface and act on.
Your serve gets all the attention because it feels like the shot you control. But the return is where the breaks live, and breaks are where matches are decided. Start measuring the half of your game you have been guessing about, and you will find points you did not know you were leaving on the court. See how it works on your own footage on the how-it-works page, or check the plans when you are ready to dig into your data.
See your own game in data
Your first match is free — no credit card. Full dashboard, heatmaps, and AI coaching in a couple of hours.
Analyse my first match free