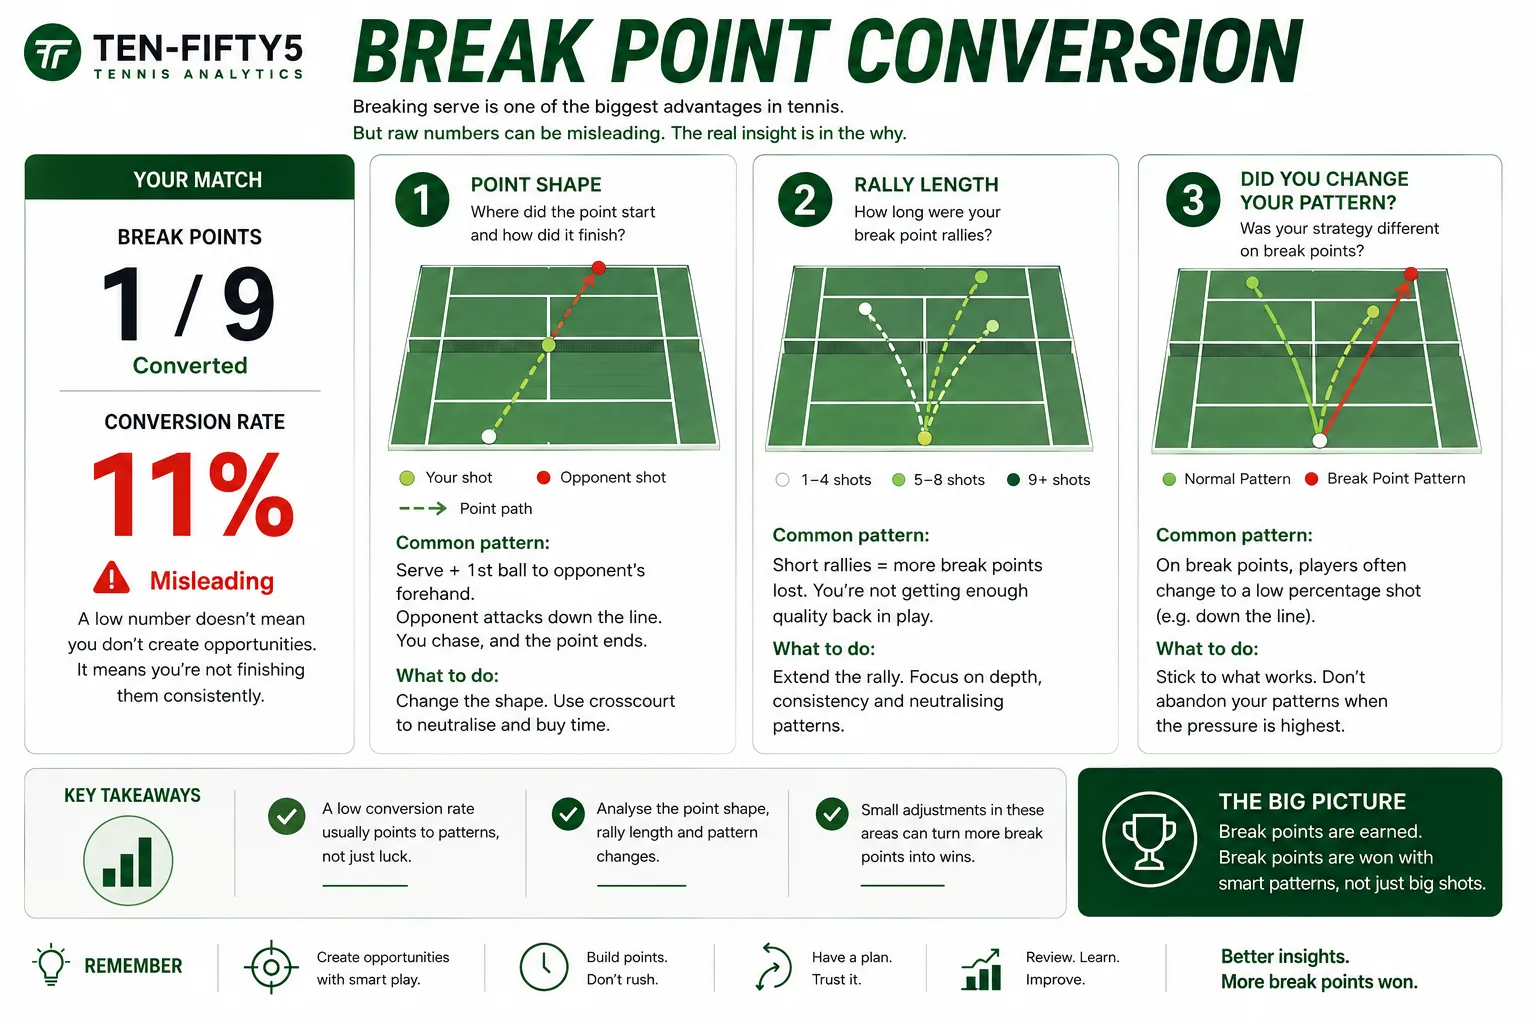
You lost 4-6, 5-7. You had nine break points and took one. The obvious conclusion writes itself: I can't play the big points.
It is almost always the wrong conclusion. Break point conversion is the most quoted number in tennis and the most consistently misread — by commentators, by coaches, and by players staring at their own match report afterwards.
Here is what it actually measures, and what to look at instead.
Break point conversion is a small-sample statistic
Most matches produce somewhere between four and twelve break points. That is a tiny sample, and tiny samples swing wildly.
Convert two of nine and you are at 22% — apparently a choker. Convert four of nine and you are at 44% — apparently ice-cold under pressure. The difference between those two players is two points, which might be two net cords, one shanked return, and a line call.
Across a season those swings average out. Across one match they dominate the number entirely. So when you read a single match's break point conversion, you are mostly reading noise — and then building a story about your character on top of it.
The bigger problem: it hides how you got there
A break point is not one thing. Reaching 0-40 on your opponent's second serve is a completely different situation from scraping to deuce-advantage against a first serve you cannot touch.
Conversion treats them identically. Both go in the denominator. So the stat quietly punishes the player who created more chances — which is exactly backwards, because creating chances is the harder skill.
If you generated nine break points, you did something right for most of that match. The number that says you failed is measuring the wrong half of the performance.
What to look at instead
Three things tell you far more than the conversion percentage.
1. What the point actually was
Pull up the break points and look at how each one ended. Not the outcome — the shape.
- Did you miss a first serve return and then get pushed off the court? That is a return position problem.
- Did you get a short ball and over-hit it? That is a decision problem under pressure.
- Did they hit three unreturnable serves? That is not your problem at all.
Those are three different diagnoses that produce the same "0 for 3". Only one of them is about nerve.
2. Rally length on the big points
This is the one that surprises people most. Compare your average rally length on break points against your average across the match.
If your break-point rallies are shorter, either you are going for too much — pressure making you try to end the point rather than win it — or you are not getting enough quality back in play off the return. Both end the point before you have earned it. If they are much longer, you may be doing the opposite: getting passive, waiting for a mistake that never comes, letting a better player back into the point.
Either way that is a concrete, coachable pattern. "Convert more break points" is not.
3. Whether you changed what was working
The most common break-point error is not a technical one. It is that players stop doing the thing that earned them the chance.
You spent eight games pulling them wide with a crosscourt forehand. You reach 0-30. Suddenly you go down the line, into the smaller target, into their strength — because the moment feels like it demands something special. [Crosscourt is the safer shot](/post/why-crosscourt-is-the-safer-shot) for a reason, and that reason does not change because the score did.
Check your [shot direction](/post/when-to-change-direction-in-tennis) on big points against your baseline. If the pattern changes at 30-40, you have found something worth fixing.
A better question than "did I convert?"
Ask instead: did I create the chance, and did I play the point I meant to play?
Those two questions have real answers, and both are visible in your match data. Break point conversion has one number and no explanation, which is precisely why it makes for good commentary and bad coaching.
What this looks like in practice
Over a handful of matches, patterns emerge that a single scoreline can never show you:
- Your break-point rally length is consistently two shots shorter than your average → you are rushing. The fix is a target, not a mindset.
- You win the majority of break points that last past six shots → you are actually excellent under pressure. Your problem is first-serve return depth, which is a technical fix.
- Your conversion is fine but you only generate two chances a match → the problem was never pressure. It is that you are not creating enough opportunities in the first place.
Each of those points to a different practice session. The raw conversion percentage points to none.
The takeaway
Break point conversion is a headline, not a diagnosis. It is small-sample, it ignores how the chance was created, and it flattens three different failure modes into one damning-looking number.
Look at the shape of the points instead: how they started, how long they lasted, and whether you played your pattern or abandoned it. That is where the actual answer lives — and unlike the percentage, it tells you what to do on Tuesday.
---
Want to see this in your own matches? [Upload a match](/login) and get point-by-point data, rally patterns and serve placement — your first match is free.
See your own game in data
Your first match is free — no credit card. Full dashboard, heatmaps, and AI coaching in a couple of hours.
Analyse my first match free