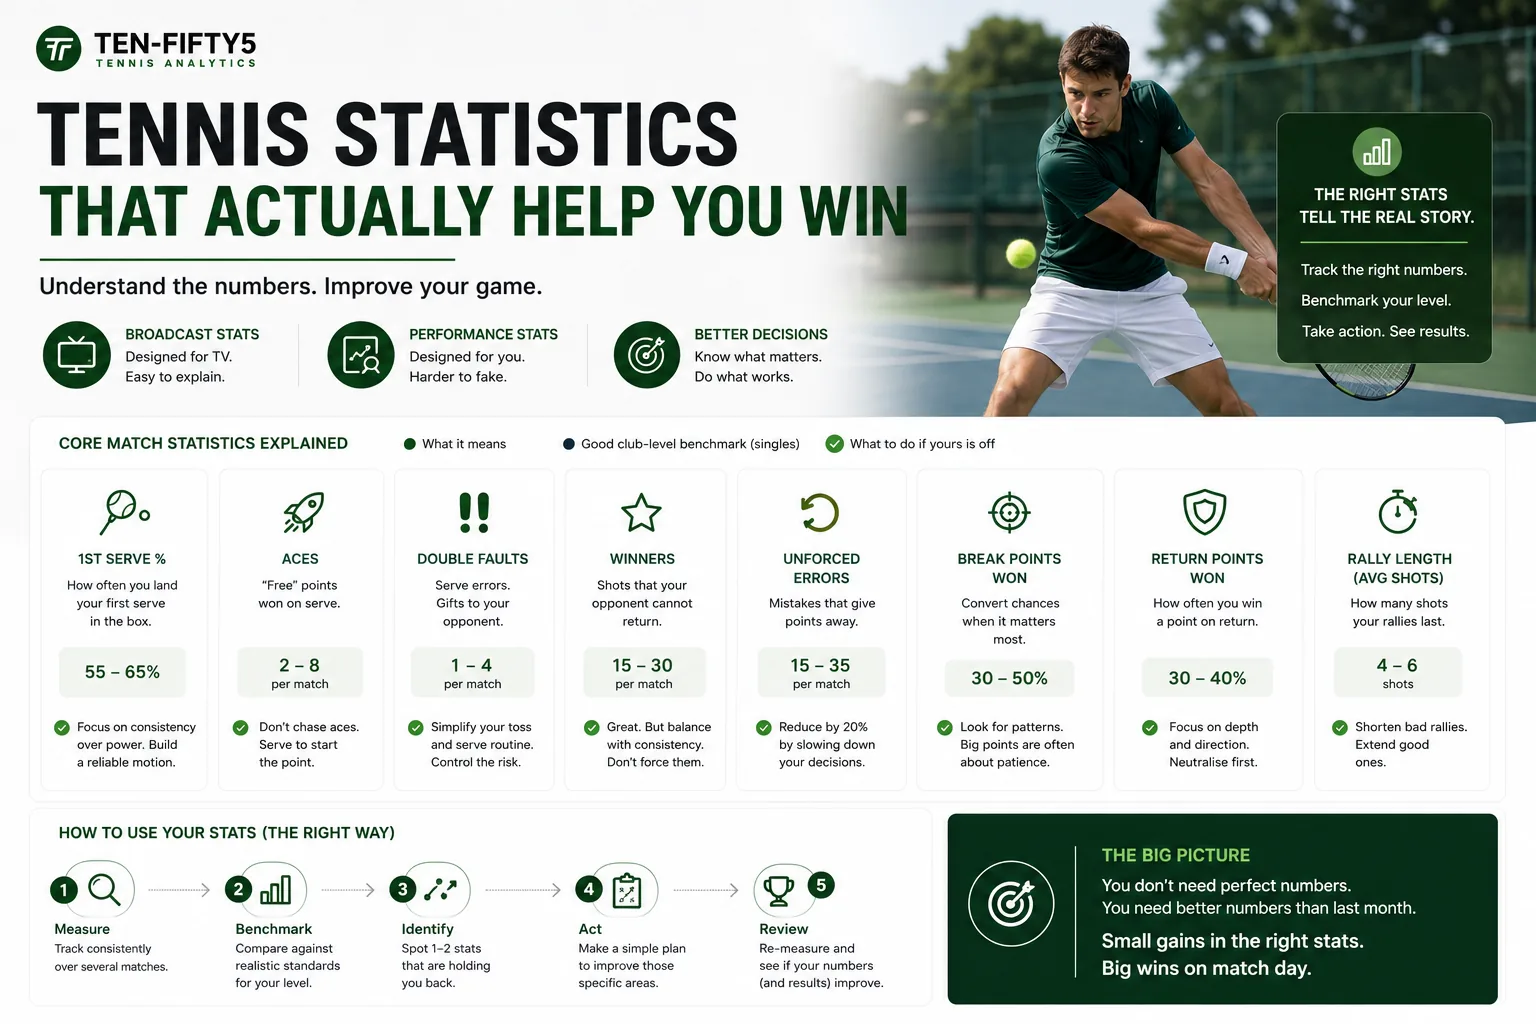
Tennis statistics have a broadcast problem. The numbers you see on a Grand Slam graphic — aces, double faults, winners, unforced errors — were chosen because they are quick to explain to a television audience during a changeover. They were not chosen because they tell you how to play better.
For a club player looking at their own match data for the first time, that creates a strange gap. You recognise the words. You do not necessarily know what the numbers should be, which ones are worth acting on, or which are essentially noise.
This is a plain-English guide to the statistics that describe a real amateur match: what each one means, what a reasonable club-level figure looks like, and what to actually do when yours is off.
Serve statistics
First-serve percentage
The share of your first serves that land in. This is the single most quoted number in tennis and the most commonly misread.
A high first-serve percentage is not automatically good. If you are landing 85% of first serves, you are almost certainly serving too softly — you have traded all your free points for safety. If you are landing 40%, you are hitting a serve you cannot control and playing most of the match from your second.
Club-level guide: 55–65% is a healthy range for most players. What matters more than the average is whether it holds — a first-serve percentage that starts at 65% and ends at 45% is a fatigue, nerve or rhythm problem, and it only shows up if you split the number by set.
Second-serve points won
The most honest number in tennis, and the one that separates levels most reliably. Your second serve is struck under the only real pressure in the sport: miss it and you lose the point immediately.
Club-level guide: winning 40–50% of your second-serve points is solid. Below about 35% and your second serve is a liability opponents will attack all afternoon.
Double faults
Not a statistic to minimise to zero. Zero double faults over a full match usually means your second serve is so conservative that it is effectively a free attacking ball for your opponent. A handful across a match is the cost of a second serve worth having. Our guide on analysing your serve with data covers how placement and speed trade off.
Serve placement spread
Not on a broadcast graphic, but far more useful than any of the above: where your serves land. A player who can only serve to one zone has a ceiling they hit the moment an opponent notices. This is what a serve heatmap shows at a glance, and what serve placement zones breaks down in detail.
Rally statistics
Rally, in one line
A rally is the sequence of shots between the serve and the end of the point, counted by shot count including the serve — so an ace is a one-shot rally. We cover the term properly, and the misconception that a rally has to be long, in what is a rally in tennis.
Rally length, and why it is the most useful number you have
Group every point in a match by how many shots it lasted — 1-3, 4-6, 7-9, 10-12, 13+ — and record your win rate in each bucket. This one chart explains more about a match than every broadcast statistic combined.
Almost every player has a bucket where their win rate falls off a cliff. Some win 70% of short points and collapse after seven shots. Others lose the quick exchanges and dominate everything past ten. Neither is wrong — but knowing which one you are is the difference between having a game plan and hoping. If you win short points, your job is to shorten them: serve bigger, step in on the return, take the ball early. If you win long ones, your job is to extend them.
Most club points are shorter than players expect. If you assume you are a grinder because you enjoy long rallies, the distribution will often tell you something quite different. Our complete guide to rally analysis covers how to read the full picture.
Outcome statistics
Winners
A shot your opponent does not touch. Satisfying, and less informative than it feels — winner counts depend heavily on who you played. A high count against a defender who returns everything means something different from a high count against someone who barely moves.
Unforced errors
A mistake made with time and balance, when you were not under pressure. This is the most weaponised and least useful raw number in amateur tennis.
The count on its own is close to meaningless, because it has no context. An aggressive game plan should produce more unforced errors than a passive one — that is the trade you are choosing. Twenty errors while hitting through the court is a completely different match from twenty errors while pushing.
What is worth tracking is the ratio of winners to unforced errors, and above all the type of error. Twenty errors from over-hitting is a shot-selection problem. Twenty from late contact is a footwork problem. The fixes have nothing in common, and the count cannot tell them apart. Reducing unforced errors using data goes into the distinction properly.
Forced errors
The shots your opponent missed because of what you did. Rarely counted at club level and genuinely valuable — a player generating lots of forced errors is applying real pressure even when the winner count looks unremarkable.
Position and pattern statistics
Court position
Where you stand while rallying. Players who camp two metres behind the baseline are usually playing safe, and it works right up until it does not — against anyone who can hit a short ball, standing deep turns every rally into a retrieval exercise.
The attack / neutral / defence split
What proportion of your shots were struck from an attacking, neutral or defensive position. This is your tactical identity in one number, and comparing it between sets you won and sets you lost is usually the fastest diagnosis available. Most players drift one way under pressure — either over-hitting or retreating — and the split makes that visible immediately.
Return performance
Return-of-serve is roughly half the match and gets a fraction of the attention. Points won on return, split by first and second serve, tells you whether you are actually pressuring the server or merely surviving. See return of serve analysis.
Pressure statistics
Break points converted and saved
Both are real, and both are far noisier than they look. A match might contain six break points in total — a sample far too small to conclude anything about your temperament. Over a season, though, a consistent pattern of converting well below 30% is worth investigating, and it is usually a shot-selection issue on the big point rather than a nerve issue.
Performance by set
Not a statistic so much as a lens, and the one most likely to change how you train. Nearly every meaningful number above — first-serve percentage, rally win rates, the attack/defence split — becomes far more informative when split across sets. Averages hide exactly the collapse you most want to find.
What good looks like at club level
| Statistic | Reasonable club range | The real signal |
|---|---|---|
| First-serve % | 55–65% | Whether it holds across sets |
| Second-serve points won | 40–50% | Below 35% and it is being attacked |
| Double faults | A few per match | Zero usually means too safe |
| Winners : unforced errors | Near 1:1 | The error type, not the count |
| Rally length distribution | Varies by style | Where your win rate falls off |
Treat these as orientation rather than targets. The genuinely useful comparison is against your own numbers from three months ago, not against a table or against the player on the next court.
Which three to start with
If you are looking at your own match data for the first time, ignore most of it and start here:
1. Win rate by rally length — tells you what game you should actually be playing. 2. First-serve percentage split by set — tells you whether you hold up. 3. The attack / neutral / defence split — tells you what you do under pressure.
Those three will change how you practise. The rest is detail you can grow into.
Frequently asked questions
What is a good first-serve percentage? For club players, 55–65%. Much higher usually means the serve is too passive; much lower means it is not controllable. Consistency across sets matters more than the average.
What is the difference between a forced and an unforced error? An unforced error is a miss made with time and balance. A forced error is one your opponent's shot caused. The distinction matters because only one of them is really your mistake.
Are unforced errors the most important stat? No — they are the most over-used. The count has no meaning without knowing your game plan and the error type. Rally-length win rate is far more actionable.
How many matches do I need before the stats mean anything? One match tells you about that match. Patterns need roughly four or five before you should trust them, which is why a rolling average matters more than any single report.
The point of any of this
Statistics do not make you better. They tell you where to point your practice, which is a much narrower and more useful claim.
A club player who knows their win rate collapses after seven shots, and trains accordingly, will improve considerably faster than one hitting cross-court forehands because that is what last week's lesson covered. That is the entire value proposition: not more numbers, but fewer and better-chosen ones.
See what a full match analysis looks like — your first match is analysed free.
See your own game in data
Your first match is free — no credit card. Full dashboard, heatmaps, and AI coaching in a couple of hours.
Analyse my first match free