The hardest twenty minutes in junior tennis is the car ride home. Your child has just lost 6-4 in the third. You saw the match. You have opinions. They know you have opinions. And almost everything you could say in that car has a decent chance of making the next tournament worse rather than better.
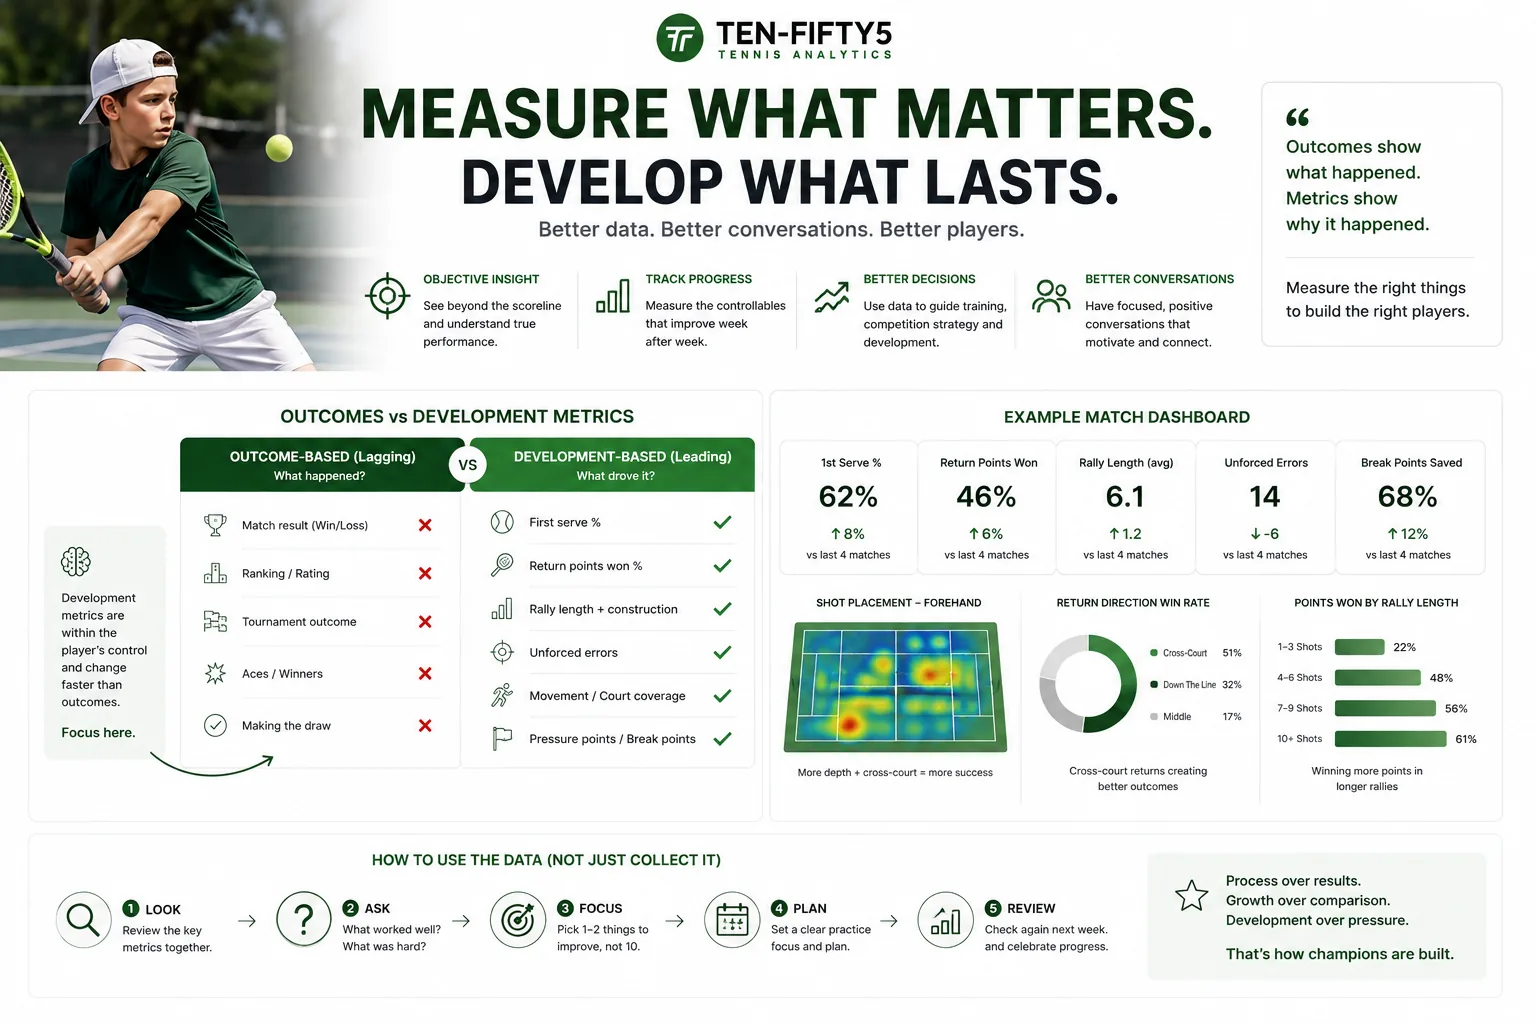
Match data does not fix that conversation on its own, but it changes what the conversation is about. Instead of "you were tight on the big points" — a judgement — you have "your first-serve percentage went from 64% in set one to 51% in set three." That is a fact, it is not anyone's fault, and it points at something trainable.
This guide is for the parents and coaches on the other side of that fence: what is genuinely worth measuring in junior tennis, what to leave alone, and how to build a season-long picture rather than an argument about one match.
Why results are the worst way to measure a junior
Three things make win-loss records unreliable at junior level, and they compound:
- Physical maturity dominates. Between roughly 11 and 15, players develop at wildly different rates. A junior who has grown 15cm this year wins matches on reach and power that have nothing to do with skill. A year later the picture inverts. Neither result told you much about either player's tennis.
- The sample is tiny. A junior might play 20–30 competitive matches a year. Professional statisticians would call that noise. Two bad draws can make a good season look like a bad one.
- Results measure the opponent as much as the player. A 6-1 6-2 win says as much about who was on the other side of the net as it does about your child.
None of this means results don't matter — they do, and juniors should learn to compete for them. It means results are a poor diagnostic. They tell you what happened, never why. And "why" is the only part you can actually train.
There is a second gap that is specific to juniors. Adult club players face the same handful of opponents at the same club, so patterns are easy to spot. Junior tennis is the opposite: unfamiliar opponents, unfamiliar conditions, often at venues the coach cannot travel to. A junior might play thirty competitive matches in a season and their coach might see six of them. The other twenty-four exist only as a scoreline and a teenager's memory of how it went — which is, reliably, a memory of the last four points. That gap is exactly what match analysis closes.
The three numbers that matter most
A junior dashboard can show eighteen KPIs. You do not need eighteen. For a developing player, three carry most of the signal.
1. First-serve percentage, split by set
A single first-serve percentage for a whole match tells you almost nothing. The same number split by set tells you a great deal.
A junior whose first serve holds at 60-65% across all three sets is keeping their technique together under fatigue and pressure. One who starts at 68% and finishes at 45% is not suddenly worse at serving in the third set — they are rushing, or tiring, or over-hitting because the score got tight. Those are three different problems with three different fixes, and the drop-off pattern is what tells the coach which one it is.
2. Win rate by rally length
This is the most useful single chart in junior tennis and the one parents most often have never seen. It groups every point by how many shots it lasted — 1-3, 4-6, 7-9, 10-12, 13+ — and shows the win rate in each bucket.
Almost every junior has a cliff edge. Some win 70% of short points and fall away after seven shots: shot-makers who cannot sustain. Others are the reverse — they lose the quick exchanges and grind everything back after ten shots. Neither is wrong. But knowing which one your child is determines the training plan, and it determines what "playing your game" actually means at 4-4 in a third set. Our guide to rally analysis covers how to read the full distribution.
3. The attack / neutral / defence split
This is the tactical identity number: what proportion of a player's shots were struck from an attacking, neutral or defensive position.
Juniors under pressure almost always drift in one direction — either they go bigger and bigger until the errors pile up, or they retreat behind the baseline and wait to be beaten. Comparing the split in sets they won against sets they lost usually makes the pattern obvious in about ten seconds.
The next tier, once those three are familiar
- Serve placement spread. Can they hit more than one zone? A junior who can only serve to the returner's forehand has a ceiling they will hit the moment opponents notice. This shows up clearly on a serve heatmap long before it shows up in results.
- Second-serve behaviour. Where the second serve lands, and whether it collapses under pressure, is one of the most honest indicators of a junior's actual confidence.
- Court position during rallies. Juniors who camp two metres behind the baseline are usually being taught to be safe. It works at 12 and stops working at 16.
- Error type, not error count. Twenty unforced errors from over-hitting is a different problem from twenty errors from poor footwork, and the fix is nothing alike.
Notice what is absent: no ranking, no win percentage, no comparison to other children. Those belong on a results page, not in a development conversation.
The stats parents should probably leave alone
Some numbers are useful to a coach and unhelpful in a parent's hands — not because parents cannot understand them, but because of what gets said afterwards.
- Unforced error counts. The most weaponised stat in junior tennis. Error counts are meaningless without context — an aggressive game plan against a strong defender should produce more errors. Left to a parent, "you made 31 unforced errors" becomes "stop missing," which is not coaching, it is pressure.
- Individual point breakdowns. The temptation to scrub to the 5-4 game and re-litigate it is enormous. Resist it. One point is noise.
- Technique scores after a single session. Biomechanical measures like kinetic-chain sequencing move slowly. A one-session dip usually means the player was tired, not that something broke.
- Anything compared against another junior. Comparison against their own baseline is motivating. Comparison against the kid who beat them is corrosive.
- Serve speed. The number parents gravitate to fastest, and the one that correlates least with junior development. Below tour level, placement, spin and repeatability decide far more matches than miles per hour — and chasing mph at 14 has cost more shoulders than it has won titles.
The principle that experienced coaches and national associations both land on: parents watch the trend, coaches read the match. If you look at the data monthly rather than after every loss, you will almost automatically stay on the right side of that line.
Don't drown a young player in numbers
This is where well-meaning parents most often get it wrong, and it is worth being blunt about. A full match analysis produces hundreds of data points. A ten-year-old needs roughly one.
A reasonable rule of thumb by stage:
- Under 12 — one thing per match, framed as a game. "Let's see if you can hit three different serve spots today." The data is for the adults; the child gets a single, positive instruction.
- 12–14 — two or three metrics they choose to care about, reviewed after the emotion of the match has passed. This is the age where a junior starts to enjoy seeing their own patterns.
- 15+ — the full picture, read by the player themselves. By this stage a serious junior should be able to open their own maps and tell you what they are going to work on. That is the actual goal.
The failure mode is a parent with a dashboard and a child who now believes every match is an exam. If the data increases pressure, it is doing the opposite of its job.
How to actually talk about it
Three rules that make the car ride survivable.
- Wait. Not on the drive home. Not that evening. Look at the dashboard together two days later, when the result has stopped stinging and the data is just information.
- Ask, don't tell. "Your win rate drops off after seven shots — what does that feel like when you're in one of those points?" gets you somewhere. "You can't sustain a rally" does not.
- Let the data be the third party. The great advantage of a chart is that nobody in the room drew it. It is not your opinion versus their memory. It is a line on a screen that both of you are looking at.
That is also the honest answer to the urge every tennis parent knows — the one that wants to coach from the fence. You watch the match as a spectator; the analysis happens afterwards, from footage, with evidence, and it belongs to the coach and the player rather than to whoever was loudest at the side of the court.
An AI coach grounded in your own match history helps here too — a junior can ask it "why do I lose more third sets than first sets?" and get an answer built from their own numbers, without a parent in the loop at all. For a lot of teenagers that is a considerably easier conversation to have.
Set it up so everyone sees the same thing
The structural problem in junior tennis is that the player, the parent and the coach each hold a different fragment of the picture.
On Ten-Fifty5, the player — or the parent, for younger juniors — holds the account and the credits, and invites their coach in from the Locker Room. The coach gets access to that player's full history for free — coach accounts cost nothing, with no limit on players — and can upload matches on the player's behalf, using the player's credits. For a squad or an age group, an academy setup puts every coach on the same roster.
The practical effect: the travelling parent films, the coach who could not travel reads the match, and the player owns the history. Nobody is forwarding video files on WhatsApp.
Track a season, not a match
One match tells you almost nothing about a junior. The value is in the trend, and junior improvement is neither linear nor visible match to match. Across a season you are looking for a set of slow upward drifts:
- First-serve percentage holding steadier across sets, even if the average barely moves
- The rally-length cliff edge pushing outward — the drop-off starting at ten shots instead of seven
- The attack/neutral/defence split staying stable in tight sets rather than collapsing one way
- Court position creeping forward as confidence grows, and the backhand error cluster shrinking since the coach started working on it
- Technique scores trending up across sessions, benchmarked against skill level rather than against other players
None of those show up in a scoreline. All of them show up in a rolling five-match average, which is why the trending view matters more than any individual match report.
That is also the honest way to answer the question every tennis parent actually has — is my child improving? — during the long stretches when results say nothing at all, which in junior tennis is most of the time.
A simple weekly routine
For a junior playing regular competition, this is enough:
- Film one competitive match a week. Phone on a tripod behind the baseline at roughly head height, both players in frame. Our guide on how to film a match for analysis covers the setup in detail, including a section for parents recording at tournaments.
- Upload it the same day, while the player still remembers the match.
- Let the coach read it first and bring one thing to the next session.
- Pick one focus for the next block of practice, and re-measure next match.
- Look at the trends monthly, not weekly — that is where a parent's attention is genuinely useful.
One match a week is roughly three or four a month, which sits comfortably inside a Starter or Standard plan, and the first one costs nothing at all.
Frequently asked questions
What age should a junior start using match analytics? Around 12 is a sensible age for a player to start engaging with their own data, though parents and coaches can usefully analyse footage well before that. Below 12, keep what the child sees to one simple, positive instruction per match.
Does analysing matches put more pressure on a young player? It can, if it is used to audit them. Used properly it does the reverse: it moves judgement off the scoreline and onto things the player controls and can improve, and it gives a parent something constructive to do with match footage other than critique.
What if my child loses but plays well? This is exactly the case data is for. Serve spread, rally win rates and court position will show a performance that improved even when the result did not — which is the most valuable thing you can show a discouraged junior.
Which single stat should a parent look at first? Win rate by rally length. It is the one chart that explains most of what happened in a junior match, and it points at a training plan rather than at a person.
Do I need expensive equipment to film a junior's match? No. A modern phone at 720p on a basic tripod behind the baseline produces footage that analyses perfectly well. No branded camera stick or court hardware is required.
Can a coach see several players' data in one place? Yes — coach accounts carry a linked roster, so a coach can track development across every junior they work with rather than match by match.
The point of measuring
Junior tennis is a long project measured with short, noisy instruments. Rankings move for reasons that have nothing to do with development, and a season can look flat while a player is quietly getting much better underneath it.
Good data does not add pressure to that — it removes it, by giving everyone involved something honest to look at other than the result. Film a few matches, watch the trends rather than the scores, and pick one thing at a time.
See what a full match analysis looks like — your first match is analysed free.
See your own game in data
Your first match is free — no credit card. Full dashboard, heatmaps, and AI coaching in a couple of hours.
Analyse my first match free